
Source Code Metrics
300+ metrics providing objective measurement and
visualisation of non-functional qualities


Testing effort estimation
Understanding the complexity of source code is essential for estimating the time required for testing. Cantata’s source code metrics utilize industry-standard complexity measures to provide accurate estimations of testing efforts for source items. For example, McCabe Cyclomatic Complexity and its variants can be used to determine the minimum number of test cases needed to achieve complete decision code coverage.
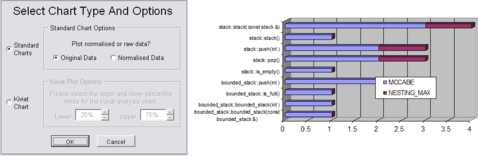
Visualising and reporting metrics
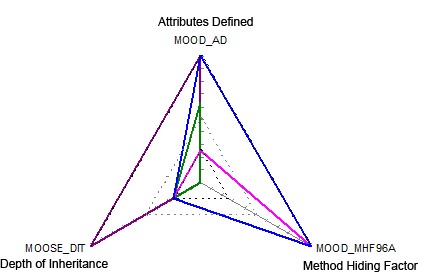
Visualizing data through graphs can enhance understanding and provide an overall view of trends that may not be immediately apparent from numerical metrics alone. Graphs can be plotted at various levels, including class, function, or category. While formatted metrics are valuable, graphical representation can be even more useful for data analysis.
Example uses of metrics
As Cantata can produce over 300 static metrics on source code, below are some examples of specific metrics and their most useful application. For an exhaustive list please refer to the Cantata manual.
Standard Code Size Metrics
These are simple metrics regarding the number of lines of code, comments, etc.
| Name | Description | Scope |
|---|---|---|
| LINE_CODE | Total number of lines of code (including blank lines and comments). | Function or system |
| LINE_COMMENT | Total number of lines of comments (both C and C++). | Function or system |
| LINE_SOURCE | Total number of lines of source code (not including blank lines or comments). | Function or system |
Standard Code Quality Metrics
The quality of a piece of software is to some degree based on the number of occurrences of dubious code contained within it. These metrics alert the user of such occurrences.
| Name | Description | Scope |
|---|---|---|
| LABEL_GOTOUSED | Number of goto labels that are used. | Function or system |
| LABEL_GOTOUNUSED | Number of unused goto labels. | Function or system |
| STMT_GOTO | Number of goto statements. | Function or system |
| SWITCH_NODEF | Number of switch statements with no default. | Function or system |
| SWITCH_FALLTHRU | Number of non-empty case blocks which fall through to the next case block. | Function or system |
| UNREACHABLE | Number of statically unreachable statements in the given scope. | Function or system |
Standard Complexity Metrics
The complexity of a piece of code is generally regarded as a measure that will affect the effort involved with maintaining it. These metrics attempt to estimate the complexity of the software based on various factors, such as the level of nesting.
| Name | Description | Scope |
|---|---|---|
| HALSTEAD_PARAMS | Number of parameters. | Function |
| MCCABE | The McCabe Cyclomatic Complexity value for the function. | Function |
| NESTING_MAX | Maximum statement nesting level. | Function |
| NESTING_SUM | Sum of the statement nesting levels for all statements in the function. | Function |
Specialist Object Oriented Metrics
Many standard metrics are still applicable to OO systems. For example, the maximum nesting levels within functions is also applicable to class methods. However there are also a range of specific OO metrics. These may be with respect to a given class, or for the system as a whole.
| Name | Description | Scope |
|---|---|---|
| MAX_DEPTH | Maximum length of inheritance path to ultimate base class. | System |
| MOOD_AD | Number of new attributes defined for this class. | Class |
| MOOD_MD | Number of new methods plus overridden methods defined for this class. | Class |
| MOOD_AHF | Proportion of attributes that are hidden (private or protected). | Class |
| MOOD_MHF | Proportion of methods that are hidden (private or protected). | Class |
| MOOSE_CBO | Level of coupling between objects. The number of classes with which this class is coupled (via a non-inheritance dependency from this class to that, or vice versa). | System |
| MOOSE_WMC_MCCABE | Average McCabe Cyclomatic Complexity value of for all methods of the class (excluding inherited methods) defined in this translation unit. | Class |
| MOOSE_LCOM98 | Chidamber & Kemerer’s Lack of Cohesion of Methods metric (1998 definition). The minimum number of disjoint clusters of (new or overridden) methods (excluding constructors), where each cluster operates on disjoint set of (new) instance variables. | Class |
| MOOSE_RFC | Chidamber & Kemerer’s Response for a class metric. The number of methods or functions defined in the class or called by methods of the class. | Class |
The ‘OO’ aspects of the C++ language have tended to render the old procedural C metrics less useful, but fortunately new sets of metrics have taken their place. The popular ones include MOOSE (Metrics for OO Software Engineering), MOOD (Metrics for OO Design), and QMOOD (Quality Metrics for OO Design). Between them they define a number of metrics which can be useful for judging whether a C++ class is ‘worth testing’. Some examples are:
| Quality identified in source code | EXAMPLE METRICS |
|---|---|
| Poor or Questionable Design |
‘MCCABE Quality’ ‘MOOSE Lack of Cohesion among Methods’ ‘MOOD Attribute Hiding Factor’ |
| Estimated Number of Faults |
‘MOOD Methods Defined’ ‘MOOD Attributes Defined’ ‘MOOSE Weighted Methods in Class’ |
| General Complexity |
‘MOOSE Depth of Inheritance’ ‘QMOOD Number of Ancestors’ ‘MOOSE Number of Children’ |
| Estimated Test Effort |
‘Methods Available’ ‘MOOSE Response for a Class’ ‘MOOSE Coupling Between Objects’ ‘MOOD Method Hiding Factor’ |
Additional System Metrics
Additional system level metrics can be created by taking averages for various class or function scope metrics. For example, we can calculate the mean McCabe Cyclomatic Complexity value for all functions or methods within our system.